Potloc
Potloc developed a comprehensive market research analysis tool to help companies easily extract actionable insights.

The start of Potloc
Potloc did not start off as a SAAS company. Rather in their initial years, the founders would provide clients a with Google Slides deck and PDF report of their research findings.
My Role
I was the only UX/UI designer in a team of 1 PM and 5 Engineers (3 frontend, 2 backend). I was responsible for leading user research, conducting design workshops with internal teams, creating low and high fidelity designs and doing user testing.
The Problem
In early 2016, Potloc’s founders realized with the volume of clients they had, their manual processes were not scalable and reached it’s limits. So they decided to create a web app and become a SAAS company. The app was built on the hypothesis that clients want to be able to dig deep into their raw data and analyze insights at a granular level.
After releasing their web app in 2018, Potloc experienced poor metrics in their product objectives.
Users dropped off after 30 seconds and rarely revisited the app.
Most of their advanced analytics features were not being used.
On top of that, users kept requesting for ways to extract and download the results data to be able to present to their leadership teams.
Preview of the first phase of the Potloc app
Research
I led user interviews with our clients to get a better understanding of their needs and expectations from our product. I also supported the implementation of UXCam into our system and spent weeks reviewing how users were interacting with the app.
Our major learnings from research were:
The initial hypothesis was incorrect. Clients wanted less granularity. Rather, they wanted well organized and narrowed down data that is intuitive and easy to digest.
Clients simply did not have the time to dig deep into data. If it was up to them, they would simply ask for a one page report with direct suggestions of what actions to take.

Solution and Outcomes
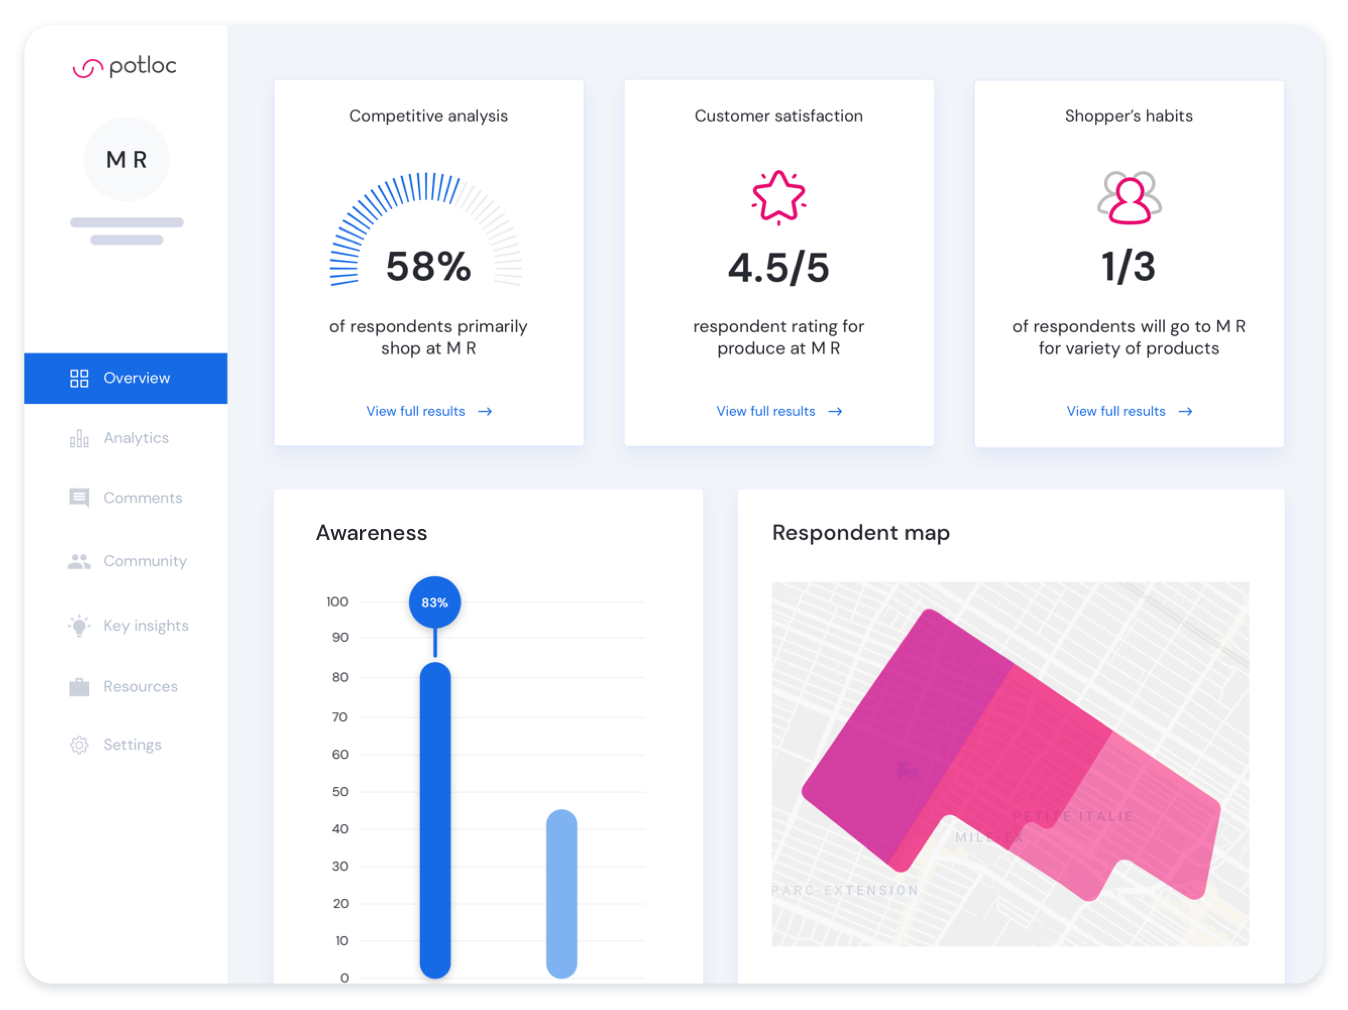
We used this research data to toy with the idea of a Dashboard that summarizes Key Insights at first glance. A Dashboard with emphasis on visual hierarchy that clients could quickly digest and gather key findings from.
We also introduced a Presentation Mode feature which clients could use to simply present this Dashboard in their exec meetings to make decisions on next steps.

New Overview Dashboard
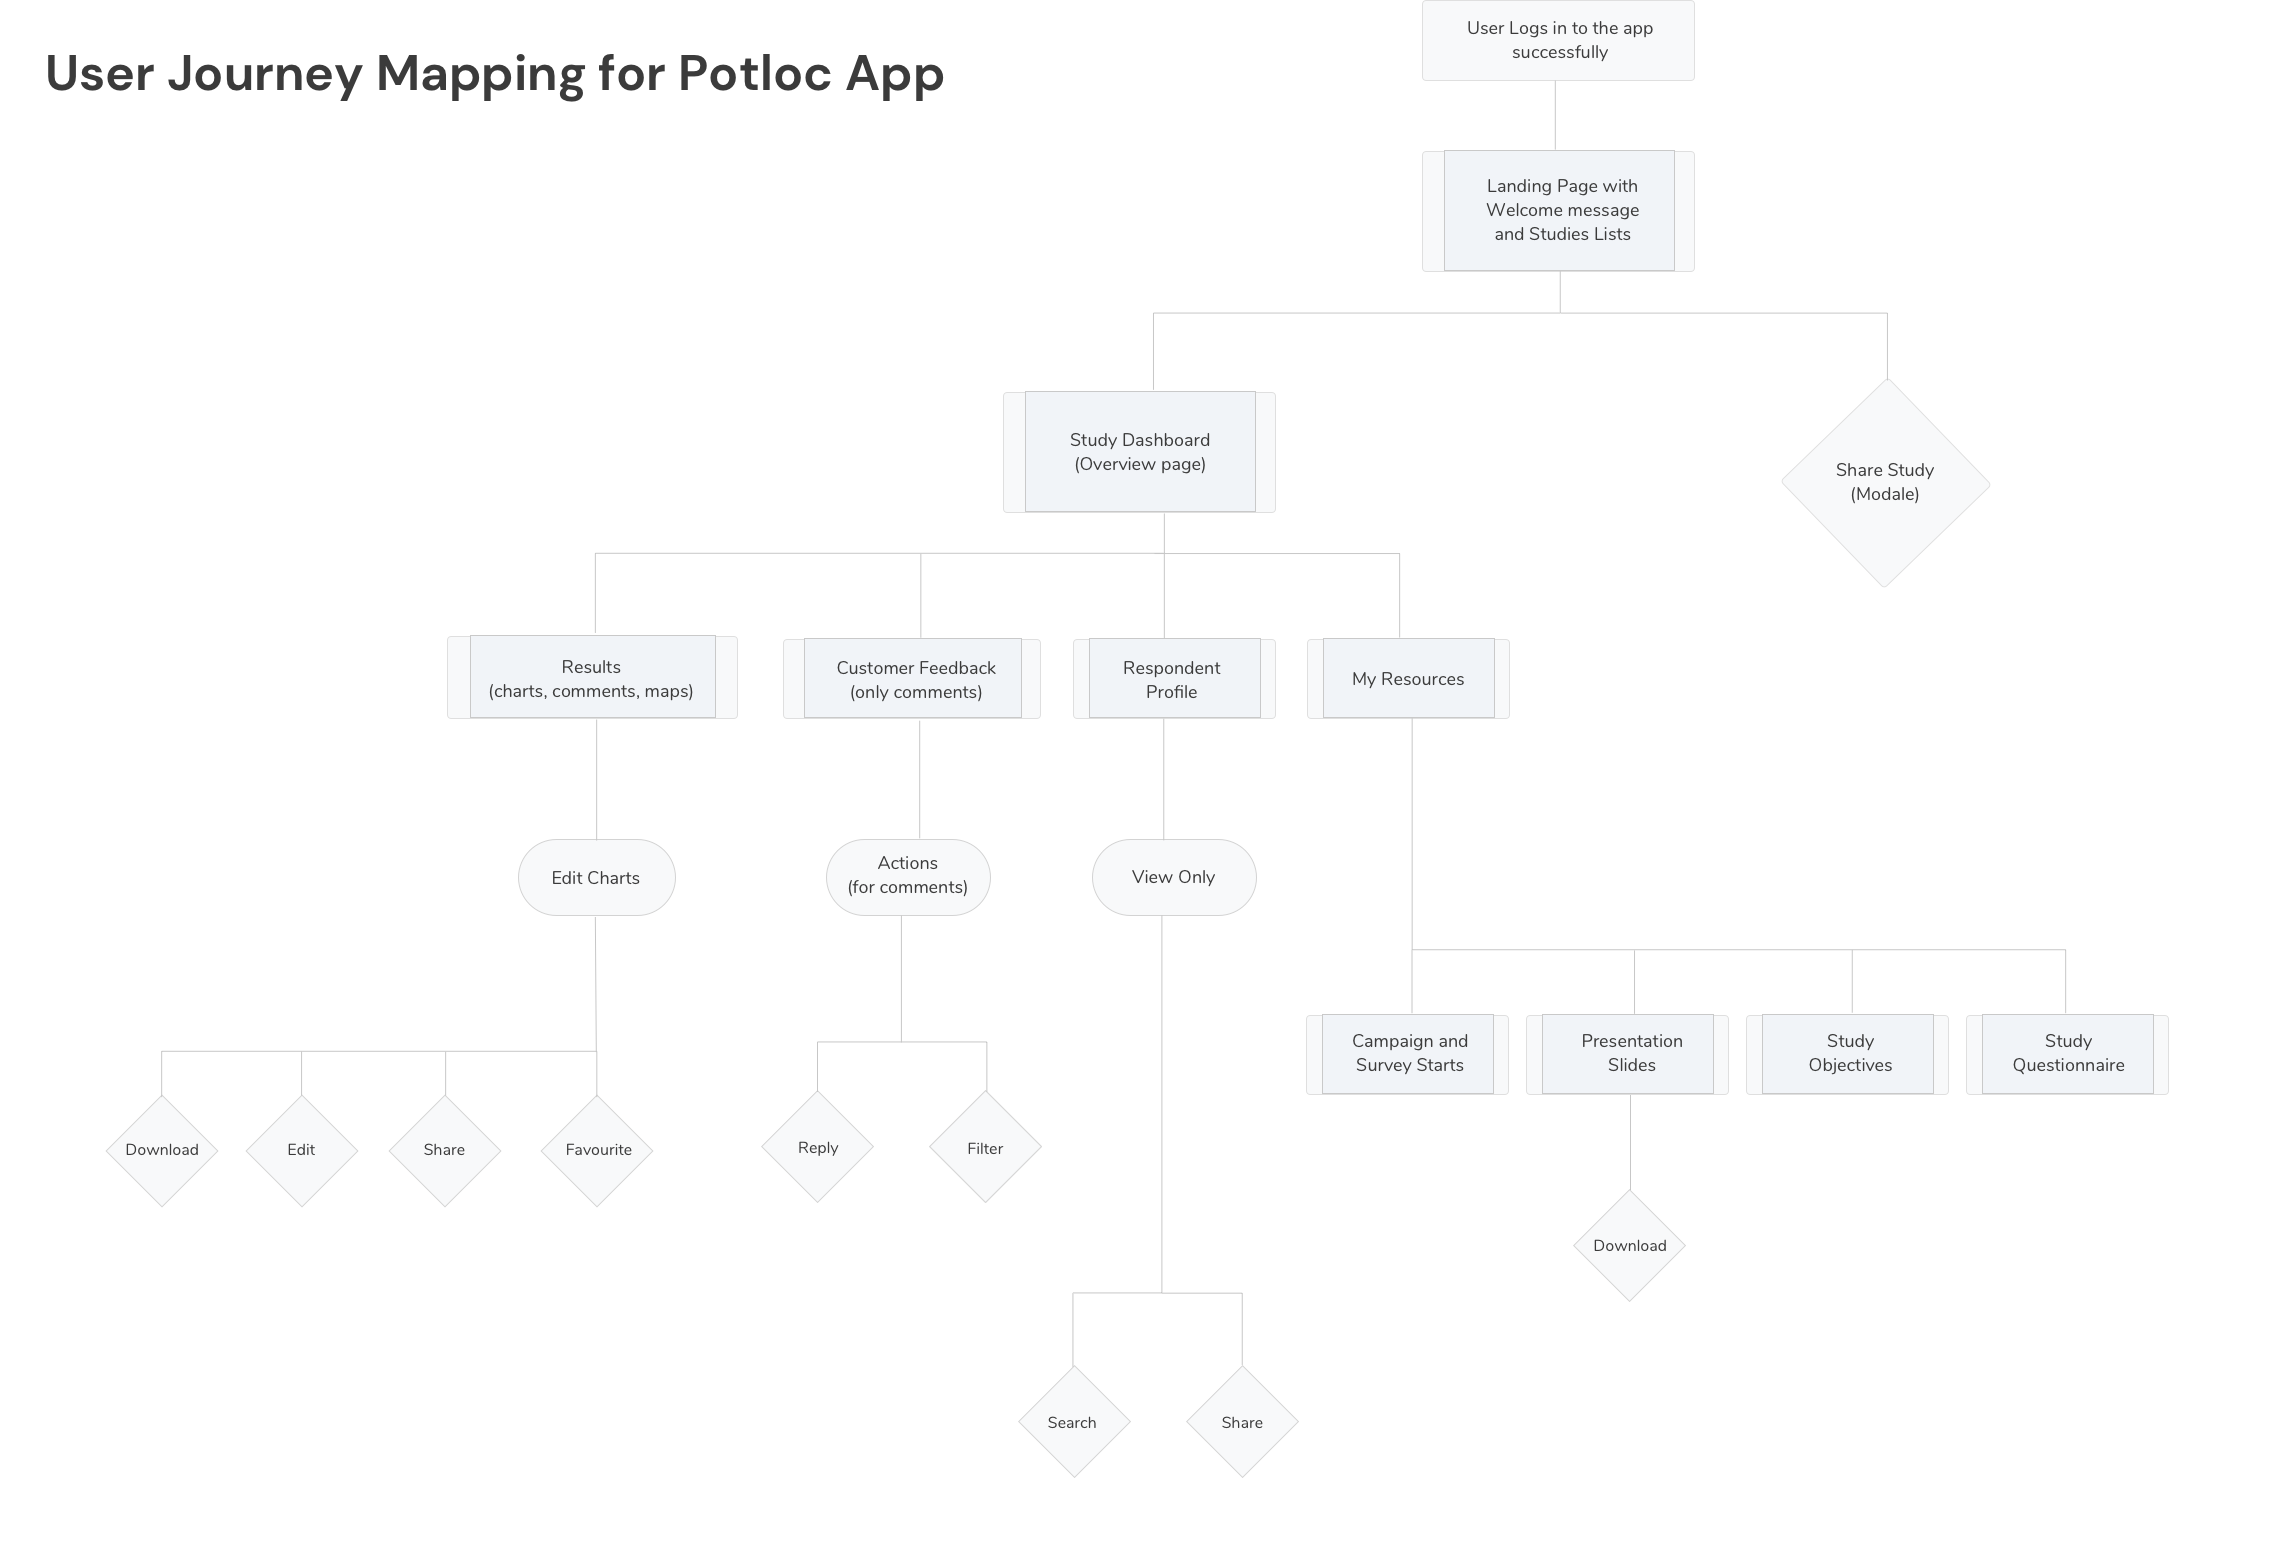
Architecture change
We refined the information architecture with 3 objectives. The platform should be:
Intuitive: Run deep analyses and manipulate your data instantly. No training needed.
Collaborative: Easily share specific parts of your analyses with colleagues so they can leverage the insights valuable to them.
Efficient: Our dashboard is a centralized tool which integrates perfectly with your own work processes and functions. Easily generate analyses on the fly and export them for your various business needs.
Overall, the new flow and architecture of the app reflected the expected user journey where data is served at a high level with the ability to dig deeper if needed.

Impact
These changes were massively successful in directing Potloc towards creating the right tool with the right market fit.
Drop-off rates decreased by over 50%.
Average time spent in app also increased by 120%. Users were not only spending more time analyzing data on Potloc but also using the Presentation feature for internal and exec meetings.
